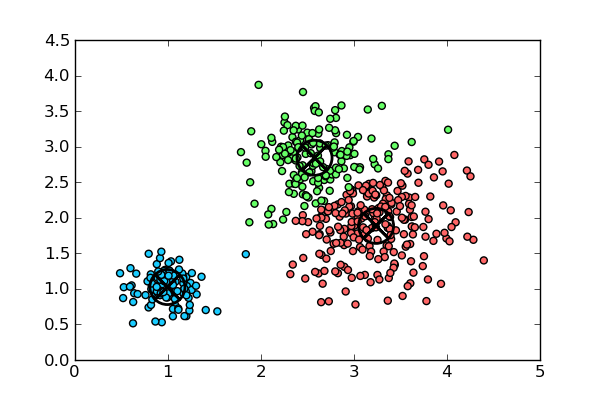
I had to illustrate a k-means algorithm for my thesis, but I could not find any existing examples that were both simple and looked good on paper. See below for Python code that does just what I wanted.
#!/usr/bin/python # Adapted from http://hackmap.blogspot.com/2007/09/k-means-clustering-in-scipy.html import numpy import matplotlib matplotlib.use('Agg') from scipy.cluster.vq import * import pylab pylab.close() # generate 3 sets of normally distributed points around # different means with different variances pt1 = numpy.random.normal(1, 0.2, (100,2)) pt2 = numpy.random.normal(2, 0.5, (300,2)) pt3 = numpy.random.normal(3, 0.3, (100,2)) # slightly move sets 2 and 3 (for a prettier output) pt2[:,0] += 1 pt3[:,0] -= 0.5 xy = numpy.concatenate((pt1, pt2, pt3)) # kmeans for 3 clusters res, idx = kmeans2(numpy.array(zip(xy[:,0],xy[:,1])),3) colors = ([([0.4,1,0.4],[1,0.4,0.4],[0.1,0.8,1])[i] for i in idx]) # plot colored points pylab.scatter(xy[:,0],xy[:,1], c=colors) # mark centroids as (X) pylab.scatter(res[:,0],res[:,1], marker='o', s = 500, linewidths=2, c='none') pylab.scatter(res[:,0],res[:,1], marker='x', s = 500, linewidths=2) pylab.savefig('/tmp/kmeans.png') |
The output looks like this (also available in vector format here):

The X’s mark cluster centers. Feel free to use any of these files for whatever purposes. An attribution would be nice, but is not required :-).
21 responses
Do you want to comment?
Comments RSS and TrackBack Identifier URI ?
Trackbacks